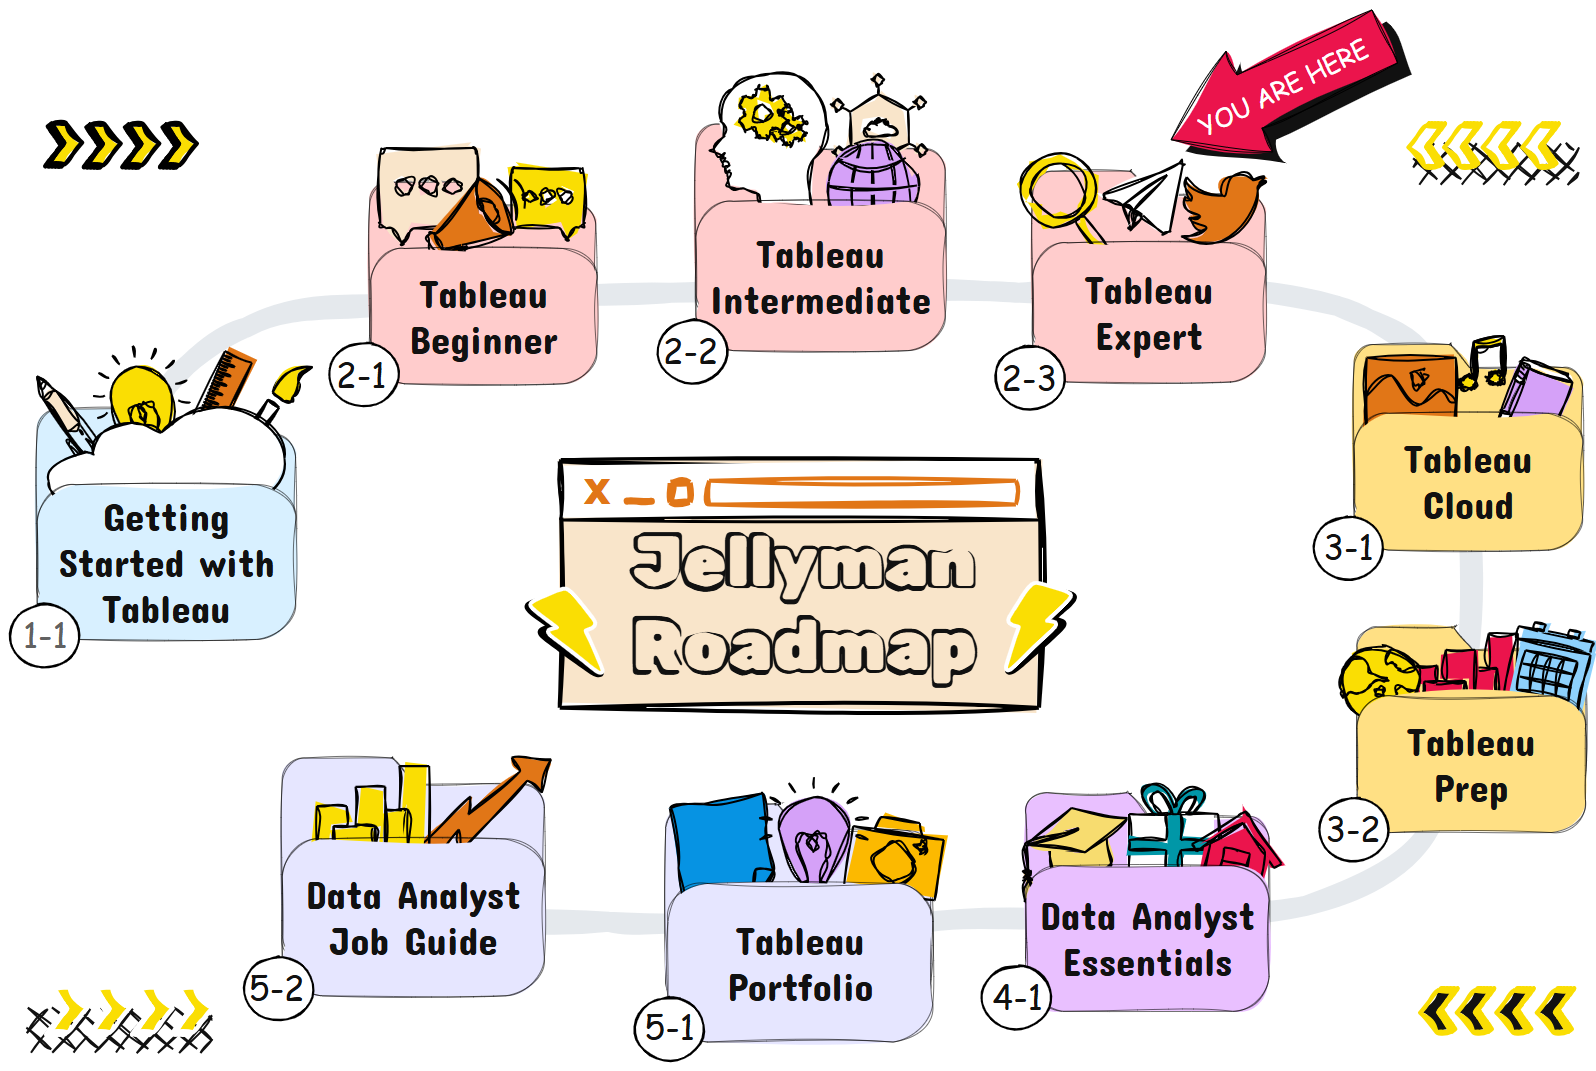
Learning Outcomes

If you're about to take this course, you are officially one of the most advanced users in the general population. My experience in the industry is that data users (which is essentially all workers in the world today) are lumped into a few groups.


1) Excel only (80%)
2) Basic BI - Line and Bar Charts (10%)
3) Intermediate - Formulas and Basic Cleansing (5%)
4) Advanced - Joining and Data Consoldiation (3%)
5) Hero Level - THATS YOU!! <2%

These figures are not exaggerated. You'll be shocked at how few people elevate to this level of capability.

It is the reason for my personal success that shocked me when I first joined the industry. I made the mistake thinking everyone could do what I do.
  • Data Preparation - Joins, Unions and Blends

    As you advanced, you'll need to bring in data from multiple sources, stacking and connecting them in all sorts of ways.

  • LODs, Parameters and Sets

    Using LODs adds so much analytical capability to your work. It lets you traverse vertically through the data set. Parameters and sets add functionality to your visualizations for the audience.

  • Custom Visualizations

    The standard visualizations provided in Tableau aren't always sufficient in presenting some complicated data sets. I'll show you custom ones you can build for different situations.

Tableau Desktop/Public - Expert

    1. Introduction - Section Outline

      FREE PREVIEW
    2. Data Inspection and Story (Attach zip File)

    3. The Mentality of Big Data Analytics

      FREE PREVIEW
    4. Union Theory - Standard, Mismatch Fields, Missing Fields (Attach Excel File)

    5. 3 methods for Performing Unions

    6. Wildcard Unions

      FREE PREVIEW
    7. Join Theory (Attached PDF Guide)

    8. Joins Visually Explained

    9. Basic Join in Tableau (Attach Working File)

    10. Doing the Big Joins (Attach)

    11. Numerical Validation + Join Advice from a Professional

      FREE PREVIEW
    12. Answering a Query using a Union

    13. Inner Join Query - Claim Category and Contact Availability

    14. Duplicate Rows - Join Theory

    15. Double Join Theory

    16. Double Joins in Action

      FREE PREVIEW
    17. Introduction to Relationships

    18. Joins vs Relationships

    19. Many to Many Relationships - Book Borrow Example (Attach)

    20. Blends vs Relationships

    21. Cardinality and Referential Integrity

      FREE PREVIEW
    22. Assignment - Blends, Joins, Relationships

    23. Assignment Answers - Question 1

    24. Assignment Answers - Question 2

    25. Assignment Answers - Question 3

    26. Assignment Solution File (Attach Packaged Workbook)

    27. I'd love to hear what you think

    1. Section 2 Introduction

      FREE PREVIEW
    2. Parameters - Data Set Explained (Attach Data Set)

    3. Intro to Parameters - What is a Parameter

    4. Parameters using a Range

    5. More Selection Options - List and Range

    6. String Selector

      FREE PREVIEW
    7. String Selector Mixed with Aggregates

    8. String Selector to Change Dimensions for Bar Chart

    9. String Selector for a Dynamic Scatter Plot

    10. Parameter Dates

    11. Changing Date Granularity

    12. Filtering with Parameters

    13. Actions to Change Parameters Value

      FREE PREVIEW
    14. Assignment - Parameters

    15. Assignment Solutions

    1. Sets Introduction and Data Set Explained (Attach File)

      FREE PREVIEW
    2. Add to Set, Colour and Data Viz Concepts

    3. Overlapping Sets - Combined Sets - Venn Diagram

    4. Using Sets to Build a Crosstab

    5. Modifying Sets - Adding, Removing - Aliases for Sets

    6. Cohort Analysis - Tableau Online Quick Explanation - Real World Application - Combining Sets

    7. Combining Sets and Parameters - If Functions - Vs. Actions

      FREE PREVIEW
    8. Dashboard Actions with Sets

    9. Assignments (Attach File)

    10. Assignment Solution (Attach File)

    1. Level of Detail - Introduction (Attach File)

      FREE PREVIEW
    2. Data Set Explained - Level of Details Explained (Basic Explanation)

    3. Writing the LOD Formula FIXED and Replicating a View

    4. A Word of Warning - Always Build your Reference Table First to Generate the LOD. Then Build th

    5. Changing the Order of Dimensions as well as Impact of Changing the View

    6. Exclude Function Example - Comparing to Fixed

    7. Include Function - Vendor IDs

      FREE PREVIEW
    8. Combining LOD Functions - Fixed and Exclude Together

    9. Problem 1 - Number of Unique Vendors by Number of Claims per Vendor

    10. Problem 2 - LODs and Finding the Minimum Date

    11. Problem 3 - Categorizing Fees and VIsualizing Seperately - Fixed Function

      FREE PREVIEW
    12. Problem 4 - Preserving Percent of Total

    13. Problem 5 - My First Day - Counting the Number of First Date Products by Ve ndor

    14. Problem 6 - Relative Measures Comparison - Exclude Function with Parameters

    15. Problem 7 - Average of the Maximum Value

      FREE PREVIEW
    16. Problem 8 - Performing LODs and Staying at Customer ID Level

    17. Problem 9 - Customer Engagement Analysis

    18. Problem 10 - Comparing to the Median of a Range of Values

    19. Problem 11 - Insurance Renewal Rate

    20. Problem 12 - Contribution to the Whole

      FREE PREVIEW
    21. Problem 13 - Program Snapshot Visualization

    22. Problem 14 - Preserving % of a Whole

    23. Problem 15 - Comparing nth Dates

      FREE PREVIEW
    24. Concluding Remarks for LODs

    25. Further Feedback 1

    1. Introduction to Analytics Pane

      FREE PREVIEW
    2. Getting Started - Data Set Explained (Attach)

    3. Constants - Aggregations, Formatting, Application

    4. Applying Lines to Table, Pane and Cell

    5. Trick - Using If Functions to create custom constant values per pane

    6. Recalculated Aggregate Reference Lines

      FREE PREVIEW
    7. Median vs Average

    8. Quartiles Explained

    9. Linking Parameters, Boolean Colours, Double Reference Lines on Scatter

    10. Reference Bands and Distribution Bands

    11. Box Plots

    12. Totals for Crosstabs and Bar Charts - Dos and Donts

      FREE PREVIEW
    13. Working File

    14. Getting Started with Trendlines (Attach Data)

    15. Formatting Trendlines

    16. Extending the TIme Horizon and Using Describe Trendline

    17. Logarithmic and Power Functions

      FREE PREVIEW
    18. Forecasting - Basic Explanation (Attach Links to Documentation)

    19. Clusters

    1. Intro Dashboard Design Elements

    2. Datas Set Explained (Attach)

    3. Dashboard Planning

    4. Pie Charts and How to Emphasize

    5. Bar and Column Charts

    6. Hierarchy Maps

    7. Heat Maps

    8. Line Charts

    9. Area Charts

    10. Tier Structure System

    11. How to Lay Out Filters - Dashboard Actions

    12. Assignment Time (Attach Packaged)

    13. Assignment Walkthrough (Attach Packaged)

    14. Tier System Assignment (Attach Packaged)

    15. Tier System - Presentation Advice and Solution Explained

    16. Tier System - Walkthrough Solution (Attach Packaged)

    17. Objects - Tiles

    18. Text Object - Trick for Consultations (MS Paint)

    19. Object - Images (Attach Zip File)

    20. Colour Wheel

    21. Adobe Express

    22. Floating Images

    23. PDF, Image and PPt Download

    24. Cross Tab Download, Tableau Public (Link)

    25. Navigation Button and Navigation Menu

    26. Blank Objects

    27. Show and Hide - Filters and Dashboards

    28. Mobile and Tablet Customized Views

    29. Dashboard Design Assignment (Attach Packaged Workbook)

    30. Dashboard Design Assignment (Solution. Attach Packaged Workbook)

    31. Further Feedback 2

Course Details

  • 158 lessons
  • 21 hours of video content
  • Data Preparation
  • Advanced Dashboard Interactions
  • Custom Visualizations

You're part of a very small class now

I want to reiterate at just how advanced you are at this point. It's a shock that more people aren't jumping into these amazing advanced technologies. Experience has shown me that these are the main reasons why people get stuck in Excel-land.

  • Stick with the familiar

    Unbelievably, people will stick to old methods even though it takes 10 times longer.

    Change is scary for them and they've made it a habit to pull back when things are unfamiliar.

  • They're content where they are

    It's great that people are happy where they are. But I believe that if you're not growing and upskilling, you're skills are becoming slowly obsolete.

    COVID has shown us how fast the world is changing.

  • Lack of Confidence

    The reflex responses are I'm not good at computers, no one is teaching me, it's too hard and my personal favourite, I'm busy.

    As I like to say, people are too busy being busy to find better ways not to be so busy!

Student Reviews

★★★★★ Awesome Work

Bilal Abu
I loved it

★★★★★ Excellent Starting Point For New Users

Michelle Bannon
This was a very good beginner training for getting started. While I am not a beginner, I wanted to go through this and see if there was additional tips/tricks I could learn and I did. Great job on this Jellyman!

★★★★★ This Was Absolutely Great!

Andrea Munoz
This is a great introduction to tableau. I enjoyed your course very much and can't thank you enough for having this up for free. I have an interview on Friday that requires Tableau exposure, so I feel 100 times more prepared now! Thank you!

★★★★★ Great Simple Introduction To Tableau

Margot Drewe
Finally a simple explanation to the why of Tableau. I have watched many tutorials on how to use Tableau but Jellyman was the first one that was able to explain to me why Tableau and not Excel. The explanations Jellyman uses to explain the how of Tableau was so easy to comprehend I'm confident to take Tableau to the next stage. Thanks Jellyman!

★★★★★ Great Starter Course For Tableau

Deepak Holla
Hi All, I really loved the way Jed has covered the topics of Tableau in this course. I knew a bit of Tableau when I started this course but I must say that I did learn few new things in this course. The USP of this starter course was the knowledge that he shared with respect to the general stuff of where each of the topics might be used e.g: Where we could actually make use of a Running total in the real world. I cannot wait to start the Advanced course. I recommend anyone who is new to Tableau to take up this ""Getting Started with Tableau"" course!!!! Regards, Deepak.

★★★★☆ Good

Taps Rale
Good

★★★★★ Excellent

Param Van


★★★★★ Outstanding Introduction

Mark Freeman
This course was so much fun that I couldn't wait to get up this morning and work on it over coffee. The instructor is engaging and personable while gently explaining exactly how to get started. I tend to be more of a book learning person, but that isn't so easy with such a complex application. This is the perfect combination of walkthrough and hands on exercises.

★★★★★ Super Stuff

Gokulakrishnan Selvam
Quick and compact review, easy understanding format. Covers all product uses and costs. Thank you so much ❤

Like what you see? Want to become a Tableau Champion?

Simply click the link below to start your 14-day free trial