This is your Chance to Showcase your Newly Discovered Design Skills

It's Not Enough to Tell Employers, We're Going to Show Them

What You'll Learn in this Course

Build a stunning Tableau Portfolio that instantly proves your skills, impresses employers, and creates powerful interview talking points through custom, professional-grade visualizations published on Tableau Public.

  • Custom Visualizations – Create visualizations that showcase real-world skills

  • Professional Portfolio – Design a Tableau Portfolio that truly stands out

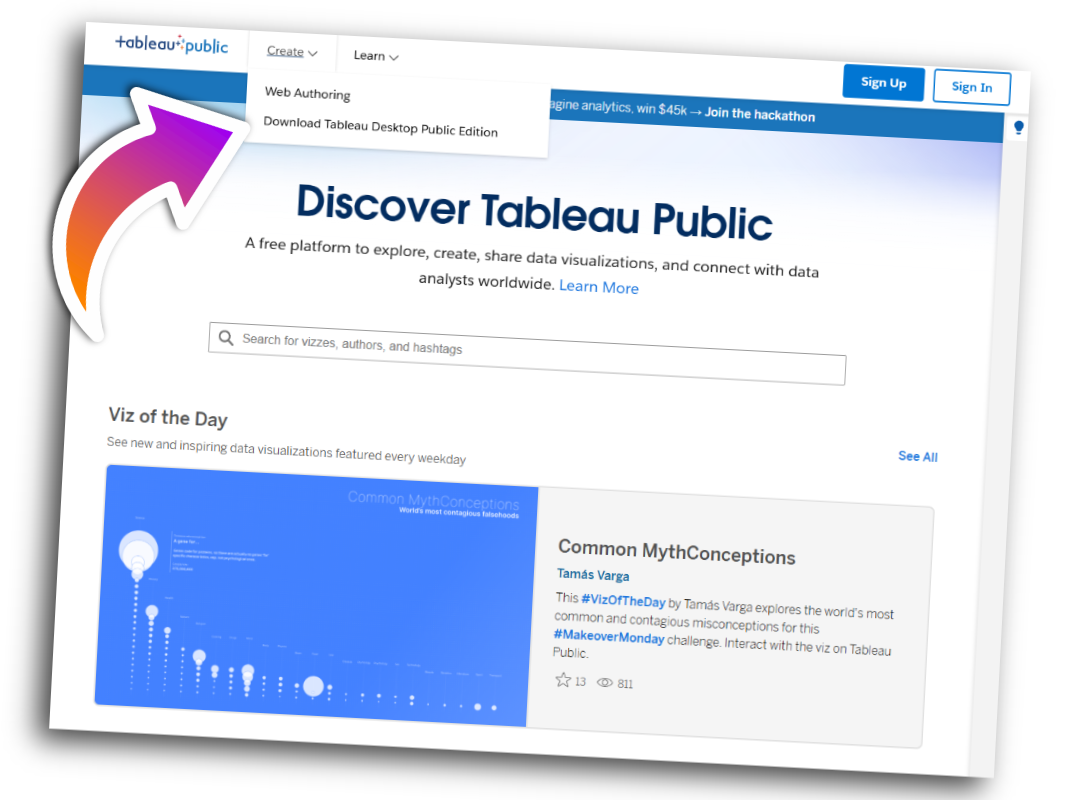
  • Public Presence – Leverage Tableau Public to impress employers

Mission to Mars

Data Storytelling Meets Sci-Fi Design

Skills Built: Layout strategy, bar charts, visual hierarchy, color contrast, themed design, user-centric storytelling

Create a space-themed Tableau dashboard inspired by a Mars mission briefing. Learn to use layout, contrast, and storytelling to make data engaging and portfolio-ready.

Beware! Godzilla!

Creative Analytics & Themed Design

Skills Built: Mapping, time-series analysis, parameters & set actions, annotations, color contrast, layout strategy, data storytelling

Build a cinematic Tableau dashboard that tracks “Godzilla” sightings. Combine maps, trend lines, and callouts to create an engaging, portfolio-ready narrative.

Cancer Patients

Outcomes & Insightful Segmentation

Skills Built: Cohort analysis, LOD expressions, parameter controls, filters & groups, KPI design, demographics profiling, annotated storytelling

Create a clear, compassionate dashboard exploring patient outcomes by age, stage, treatment, and facility. Build KPIs, cohorts, and drilldowns to reveal trends and drive evidence-based decisions—polished and portfolio-ready.

African Energy Revolution

Mapping the Future

Skills Built: Hierarchy maps, annotated geography, moving averages, bar charts, color theory, thematic storytelling, data segmentation

Design a bold dashboard visualizing Africa’s renewable energy growth. Combine maps, hierarchies, and trends to tell a compelling story of innovation and opportunity.

What You Get In This Course

  • 50+ Videos

    Learn through over 50 bite-sized lessons that guide you step by step, making Tableau simple and approachable for complete beginners.

  • Quizzes to Test Your Knowledge

    Reinforce what you’ve learned with interactive quizzes designed to check your understanding and build confidence as you progress.

  • Assignments with Video Walkthroughs

    Apply your skills in real assignments and follow along with video walkthrough solutions to ensure you never feel stuck.

Course Curriculum

    1. Welcome to the Portfolio Build Collection

    2. Lesson to show screenshots of all portfolio builds so they can pick and choose

    1. Godzilla Intro

    2. Timeline 1 - Introduction

    3. Timeline 2 - 5 Steps

    4. Working Data and Images Download

    5. Timeline 4 - Data Modelling

    6. Timeline 5 - Heat Maps

    7. Timeline 6 - Bar Charts

    8. Timeline 7 - Maps

    9. Timeline 8 - Scatter Plots

    10. Timeline 9 - Final Bar

    11. Timeline 10 - Elements into Dash

    12. Timeline 11 - Shading and Padding

    13. Timeline 12 - Final Styling

    14. Timeline 13 - Tableau Public Publish

    1. Nuclear Powerplant Introduction

    2. Timeline 1 - Introduction

    3. Working Data and Images Download

    4. Timeline 2 - Bringing the Data In v2 (JME Version)

    5. Timeline 3a - Building the Line Charts

    6. Timeline 3b - Bar Charts

    7. Timeline 3c - BAN

    8. Timeline 3D - mAP

    9. Timeline 3f - Final Stying

    10. Timeline 3G - Formatting Bars

    11. Timeline 3h - Line Formatting

    12. Timeline 3i - Final Formating

    13. Timeline 3j - Deployment

    1. Cancer Research Tool Introduction

    2. Timeline 1 - Introduction

    3. Timeline 2 - Intro Steps

    4. Working Data and Images Download

    5. Timeline 3 - Downloading and Loading Data JME

    6. Timeline 4 - Building the Pill

    7. Timeline 5 - Donut Charts

    8. Timeline 6 - Age Range

    9. Timeline 7 - Waffle Chart

    10. Timeline 8 - Adding all the Elements into your Dash

    11. Timeline 9 - Placing all the Elements

    12. Timeline 10 - Formatting Colours, Spacing and Extra Donuts

    13. Timeline 11 - Final Styling and Background Image

    14. Timeline 13 - Publishing to Tableau Cloud and Public

    1. African Energy Introduction

    2. Timeline 1 - Introduction

    3. Timeline 2 - 5 Steps Intro

    4. Working Data and Images Download

    5. Timeline 3 - Loading the Data

    6. Timeline 4 - Dual Axis

    7. Timeline 5 - Hierarchy Map

    8. Timeline 6 - Bar Chart

    9. Timeline 7 - Map

    10. Timeline 8 - Adding Elements to Dash

    11. Timeline 9 - Adding Text to the Dash

    12. Timeline 10 - Background, Transparent

    13. Timeline 11 - Removing Borders

    14. Timeline 12 - Adding Colour

    15. Timeline 13 - Containers and Padding

    16. Timeline 14 - Font Selection

    17. Timeline 15 - Publishing

    18. Timeline 16 - Finish

    1. Mission to Mars Introduction

Course Details

  • 69 lessons
  • 4.5 hours of video content
  • Ideal for beginners
  • Visualization Basics
  • Apply Knowledge Immediately

HERE'S WHAT MY AWESOME STUDENTS HAVE TO SAY

AMAZING TEACHER

I love your course and could listen for hours. You distill valuable advice clearly. Found you on YouTube while struggling with LOD expressions; examples helped immensely. Grateful for accessible pricing and free content—your teaching is engaging and generous.

Emeline Courcelle

GAME-CHANGING COURSE FOR FIRST-TIME TABLEAU USERS

This course is a must for first-time Tableau users intimidated by data. Jed simplifies Tableau with step-by-step guidance: setup, import data, navigate the UI, and create visualizations. Clear, encouraging teaching—confidence transformed and ready to build. Thanks for making Tableau accessible.

Adam Lockwood

EXCELLENT COURSE

Jellyman is an excellent teacher! His content is interesting, applicable and well-explained.

He has clearly thought about the way people absorb information and doesn't gloss over any assumed knowledge like many other courses do. He has taken the time to go through methods & concepts step by step so it's almost impossible not to learn! ”

Elizabeth Deterding

AMAZING COURSE

The course is great! Feels like studying with a friend :) Everything is explained very easily and I am looking forward to the next one! ”

Anastasiia Larina

BEST TABLEAU TRAINING EVER

Totally clear and very well explained with a bunch of examples. All sensible topics – LOD, Actions and Calculated Fields are tackled.

Big Thank You! ”

Nicolaie Cozma

I LOVE LEARNING TABLEAU WITH JED

The best teacher of Tableau I have ever found! I would love to meet Jed someday in real life. I like his sense of humor and the way he explains everything.

Jed much thanx for this course. ”

Emilia B Korycka

JOINS WERE HOLDING ME BACK

Great – this was holding me back but not any more

Brian Sundermeijer

STILL LEARNING THINGS

I was wondering why we were just now covering joins when it's something I felt essential enough to be a beginner subject. Then you delved into joins versus relationships versus blends and it became much clearer – this was more complex than an entry level subject.

Great explanations all around and I have a better understanding of when to use which tool.

Update: Just finished LODs. Mind continues to be blown! Can't recommend this course enough. ”

Bryan Nylander

ONE OF THE BEST EDUCATORS ON PLANET TABLEAU

Jellyman is a fantastic teacher! His lessons are unlike others to say the least!!!

Hats off to his engineering personality and his koool sense of humour (A bit of contradiction there but definitely works like magic on our memory capacity to retain his fun lessons :) ”

Jenny Wang

AMAZING!

Take this course even if you think you're an expert in Tableau

Kamirah Martin

Tableau Portfolio FAQ

  • Do I need prior Tableau experience to start this course?

    No, you don’t need prior experience. The course is designed to guide you step by step, from foundational skills to building a polished portfolio.

  • Do I have to publish my work on Tableau Public?

    Yes, publishing on Tableau Public is highly recommended. It makes your work accessible, easy to share with employers, and proves you’re confident in showcasing your abilities.

  • How many dashboards and visualizations should my portfolio include?

    Quality matters more than quantity. Three to five strong, well-designed dashboards with diverse data sets are enough to showcase your skills and make an impact.

  • What kinds of data sets and custom visualizations will I learn to build?

    You’ll work with real-world data and learn to create custom charts, interactive dashboards, and visualizations that go far beyond the Tableau basics.

  • Can this portfolio really help me land a job as a data analyst?

    Absolutely. A strong Tableau portfolio creates instant credibility, provides a clear talking point in interviews, and sets you apart from candidates who only rely on resumes.

All Jellyman Courses

Data Analyst Job Guide Comes Next!