PROJECT: The African Energy Revolution [IN PRODUCTION]
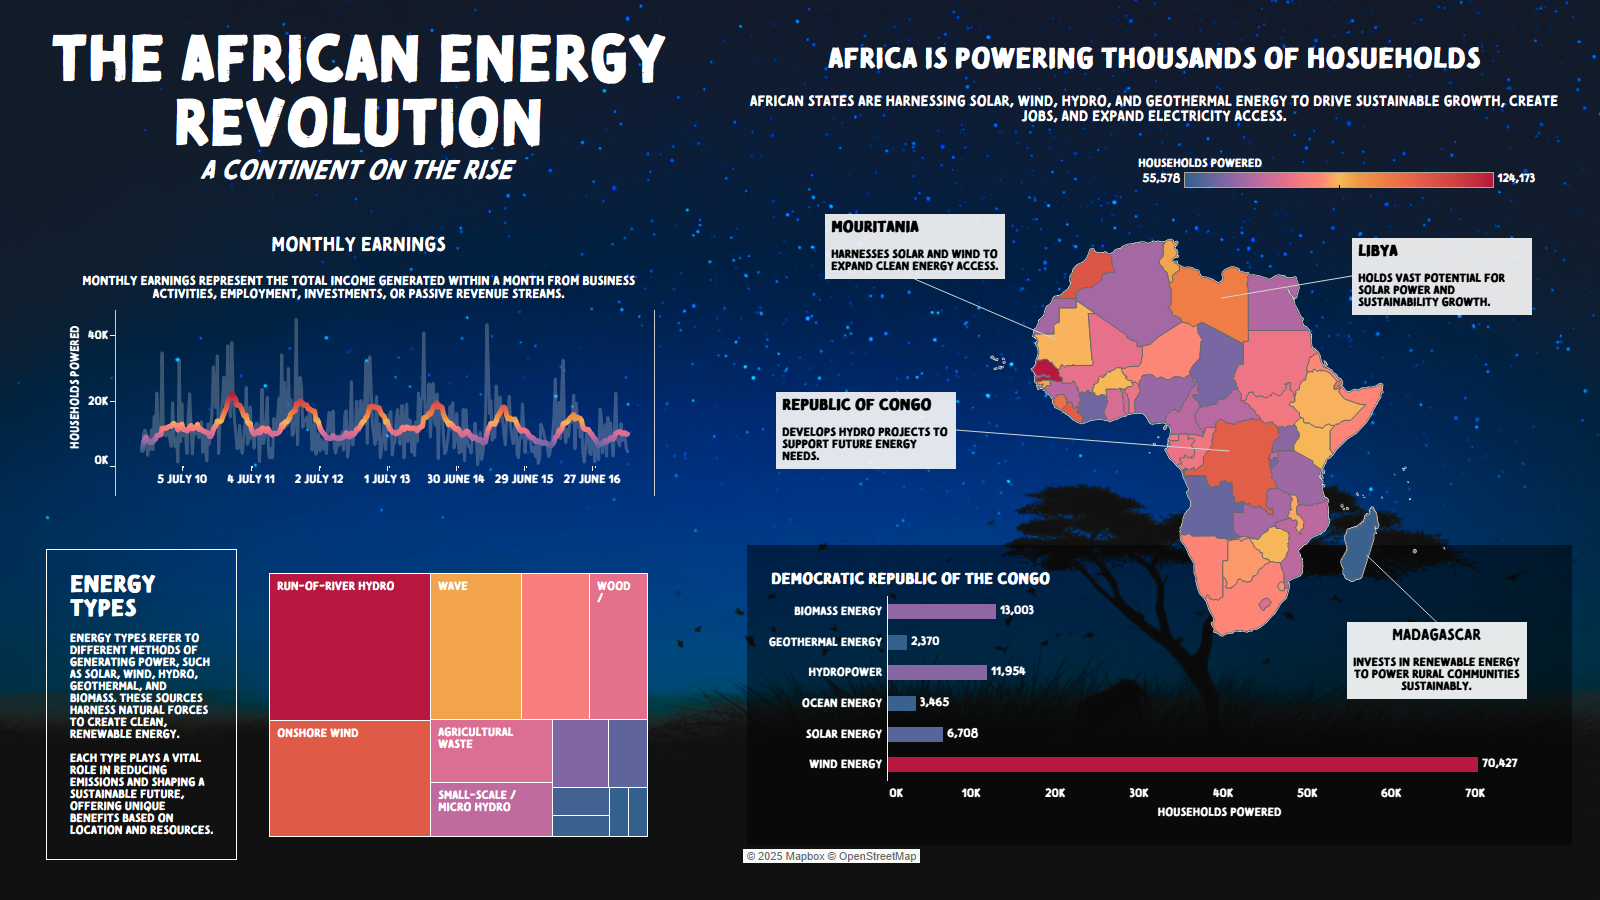
This dashboard visualizes renewable energy trends across Africa using line charts, hierarchy maps, annotations, and bar charts to highlight growth, distribution, and opportunities in solar, wind, hydro, and geothermal energy.